Electrify Chicago
An independent tool for viewing City of Chicago building data
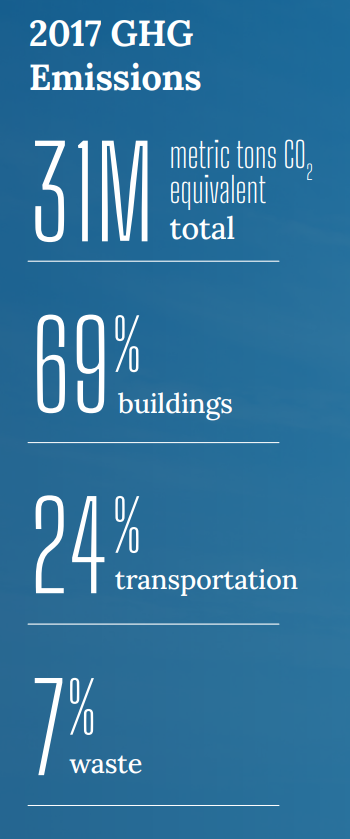
According to the
2022 Chicago Climate Action Plan ,
a whopping 69% of Chicago's emissions come from buildings, making it
our biggest challenge and our biggest opportunity as a city to tackle
change. At Electrify Chicago, we want to showcase some of the best and worst performing
buildings in the city using publicly available data and manual annotations to add
building photographs and label multi-building owners like universities.
,
a whopping 69% of Chicago's emissions come from buildings, making it
our biggest challenge and our biggest opportunity as a city to tackle
change. At Electrify Chicago, we want to showcase some of the best and worst performing
buildings in the city using publicly available data and manual annotations to add
building photographs and label multi-building owners like universities.
You can start by looking at Chicago's buildings with the highest greenhouse gas intensity - this means that they use the most energy when adjusted per unit of square foot, so big buildings could actually perform much better than very inefficient small buildings on this metric.
New Article
📰 $30 Million In Missed Fines
The City Of Chicago failed to collect $30 million in potential fines from the building benchmarking ordinance, reducing transparency and accountability.
Legislative update! 🎉
As of late January 2024, legislation is being introduced to require new use more efficient forms of water and space heating, via the Clean And Affordable Buildings Ordinance (CABO), which will reduce the number of highly polluting and inefficient buildings that end up on this site.
If you're in Chicago,
write to your alderman to support the CABO!
Chicago Buildings by Greenhouse Gas Intensity
Note: Data only includes large Chicago buildings from 2021, unless explicitly stated otherwise.
Note: This data only includes buildings whose emissions are reported
under the
Chicago Energy Benchmarking Ordinance. According to the City “As of 2016,
this list includes all commercial, institutional, and residential buildings larger than
50,000 square feet.” This dataset is also then filtered to only buildings with
reported emissions > 1,000 metric tons CO2 equivalent.
This data is also from 2021, but when new benchmark data is available, we'll update the site.
| Property Name / address | Primary Property Type |
Greenhouse Gas Intensity (kg CO2 eq./sqft) |
Total Greenhouse Emissions (metric tons CO2 eq.) |
|---|---|---|---|
|
933 Van Buren Condominium Association
933 W Van Buren St
| Multifamily Housing | 4.9 kg/sqft
Lowest 22%
| 1,458 tons
Highest 32%
|
|
3900 Lake Shore Drive Condominium Association
3900 N Lake Shore Dr
| Multifamily Housing | 4.9 kg/sqft
Lowest 22%
| 1,290 tons
Highest 36%
|
|
University Park CA
1451 E 55th St
| Multifamily Housing | 4.9 kg/sqft
Lowest 22%
| 2,636 tons
Highest 16%
|
|
Coronado Apartments LLC
1061 W ROSEMONT AVE
| Multifamily Housing | 4.9 kg/sqft
Lowest 22%
| 392 tons
Lowest 17%
|
|
2738 N. Pine Grove
2738 N PINE GROVE AVE
| Multifamily Housing | 4.9 kg/sqft
Lowest 22%
| 510 tons
Lowest 27%
|
|
Printers Row Condominium Association
711 S DEARBORN ST
| Multifamily Housing | 4.9 kg/sqft
Lowest 22%
| 1,108 tons
Highest 41%
|
|
Hyman G Rickover Naval Academy High School
5700 W BERTEAU AVE
| K-12 School | 4.9 kg/sqft
Lowest 22%
| 573 tons
Lowest 33%
|
|
One East 14th Place
5 E 14th Pl
| Multifamily Housing | 4.9 kg/sqft
Lowest 22%
| 760 tons
Lowest 45%
|
|
One Superior Place - CO (np52)
1 W Superior St
| Multifamily Housing | 4.9 kg/sqft
Lowest 22%
| 3,235 tons
Highest 12%
|
|
Sterling Condominium, The
4101 4123 N SHERIDAN RD
| Multifamily Housing | 4.9 kg/sqft
Lowest 22%
| 341 tons
Lowest 12%
|
|
Fifteen Thirty North State Parkway Building Corporation
1530 1534 N STATE PKWY
| Multifamily Housing | 4.9 kg/sqft
Lowest 22%
| 372 tons
Lowest 15%
|
|
5631-35 N Kenmore
5631 5635 N KENMORE AVE
| Multifamily Housing | 4.9 kg/sqft
Lowest 22%
| 276 tons
Lowest 7%
|
|
6214 N. Winthrop, LLC
6214 6218 N WINTHROP AVE
| Multifamily Housing | 4.9 kg/sqft
Lowest 22%
| 285 tons
Lowest 8%
|
|
EFA LLC
452 W ALDINE AVE
| Multifamily Housing | 4.9 kg/sqft
Lowest 22%
| 434 tons
Lowest 21%
|
|
Bicycle Station Lofts Condominium Association
1632 S INDIANA AVE
| Multifamily Housing | 4.9 kg/sqft
Lowest 22%
| 291 tons
Lowest 9%
|
Data Source:
Chicago Energy Benchmarking Data