Electrify Chicago
An independent tool for viewing City of Chicago building data
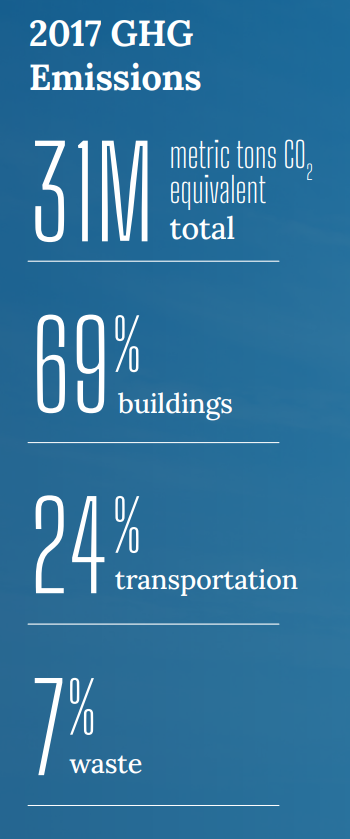
According to the
2022 Chicago Climate Action Plan ,
a whopping 69% of Chicago's emissions come from buildings, making it
our biggest challenge and our biggest opportunity as a city to tackle
change. At Electrify Chicago, we want to showcase some of the best and worst performing
buildings in the city using publicly available data and manual annotations to add
building photographs and label multi-building owners like universities.
,
a whopping 69% of Chicago's emissions come from buildings, making it
our biggest challenge and our biggest opportunity as a city to tackle
change. At Electrify Chicago, we want to showcase some of the best and worst performing
buildings in the city using publicly available data and manual annotations to add
building photographs and label multi-building owners like universities.
You can start by looking at Chicago's buildings with the highest greenhouse gas intensity - this means that they use the most energy when adjusted per unit of square foot, so big buildings could actually perform much better than very inefficient small buildings on this metric.
New Article
📰 $30 Million In Missed Fines
The City Of Chicago failed to collect $30 million in potential fines from the building benchmarking ordinance, reducing transparency and accountability.
Legislative update! 🎉
As of late January 2024, legislation is being introduced to require new use more efficient forms of water and space heating, via the Clean And Affordable Buildings Ordinance (CABO), which will reduce the number of highly polluting and inefficient buildings that end up on this site.
If you're in Chicago,
write to your alderman to support the CABO!
Chicago Buildings by Greenhouse Gas Intensity
Note: Data only includes large Chicago buildings from 2021, unless explicitly stated otherwise.
Note: This data only includes buildings whose emissions are reported
under the
Chicago Energy Benchmarking Ordinance. According to the City “As of 2016,
this list includes all commercial, institutional, and residential buildings larger than
50,000 square feet.” This dataset is also then filtered to only buildings with
reported emissions > 1,000 metric tons CO2 equivalent.
This data is also from 2021, but when new benchmark data is available, we'll update the site.
| Property Name / address | Primary Property Type |
Greenhouse Gas Intensity (kg CO2 eq./sqft) |
Total Greenhouse Emissions (metric tons CO2 eq.) |
|---|---|---|---|
|
De La Salle Institute
3434 S Michigan Ave
| K-12 School | 4.9 kg/sqft
Lowest 22%
| 815 tons
Lowest 47%
|
|
Old Post Office
🚩
404 W HARRISON ST
| Office | 4.9 kg/sqft
Lowest 22%
| 12,038 tons #49 Highest
|
|
Harper Place Condominium Association
5309 5343 S HARPER AVE
| Multifamily Housing | 4.9 kg/sqft
Lowest 22%
| 430 tons
Lowest 20%
|
|
Museum of Science and Industry
5700 S Lake Shore Dr
| Museum | 4.9 kg/sqft
Lowest 22%
| 5,884 tons
Highest 6%
|
|
311 West Monroe
311 W Monroe
| Office | 4.9 kg/sqft
Lowest 22%
| 2,069 tons
Highest 22%
|
|
Brompton
701 709 W BROMPTON AVE
| Multifamily Housing | 4.9 kg/sqft
Lowest 22%
| 260 tons
Lowest 6%
|
|
Union Row
560-648 W 16th Street
| Multifamily Housing | 4.8 kg/sqft
Lowest 20%
| 337 tons
Lowest 12%
|
|
Madden Wells Ph 1B
650 E 38TH PLACE
| Multifamily Housing | 4.8 kg/sqft
Lowest 20%
| 957 tons
Highest 47%
|
|
Elevate Lincoln Park _ CO (lv008)
930 W Altgeld St
| Multifamily Housing | 4.8 kg/sqft
Lowest 20%
| 1,537 tons
Highest 31%
|
|
Sherwin Sheridan LLC
7347 7365 Sheridan Rd
| Multifamily Housing | 4.8 kg/sqft
Lowest 20%
| 474 tons
Lowest 25%
|
|
NEXT - CO (nx04)
347 W Chestnut St
| Multifamily Housing | 4.8 kg/sqft
Lowest 20%
| 2,020 tons
Highest 22%
|
|
1345 S. Wabash Condominium Association
1345 S Wabash Ave
| Multifamily Housing | 4.8 kg/sqft
Lowest 20%
| 839 tons
Lowest 48%
|
|
Prairie Avenue Lofts
221 E Cullerton Ave
| Multifamily Housing | 4.8 kg/sqft
Lowest 20%
| 871 tons
Lowest 50%
|
|
AMLI Lofts Polk
111 W Polk St
| Multifamily Housing | 4.8 kg/sqft
Lowest 20%
| 973 tons
Highest 46%
|
|
Roosevelt Square II
(CHA)
1222 W Roosevelt Rd
| Multifamily Housing | 4.8 kg/sqft
Lowest 20%
| 757 tons
Lowest 44%
|
Data Source:
Chicago Energy Benchmarking Data