Electrify Chicago
An independent tool for viewing City of Chicago building data
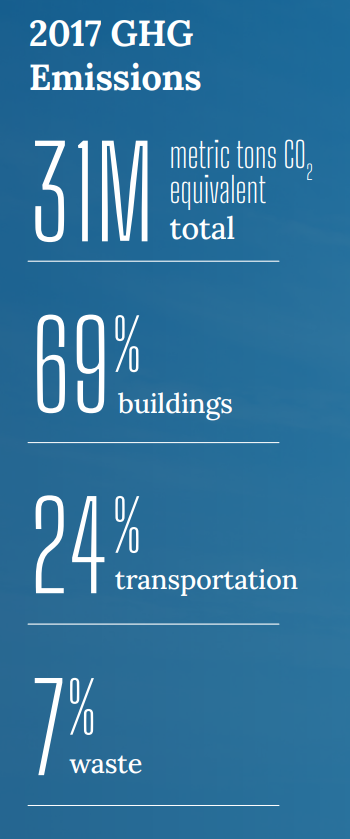
According to the
2022 Chicago Climate Action Plan ,
a whopping 69% of Chicago's emissions come from buildings, making it
our biggest challenge and our biggest opportunity as a city to tackle
change. At Electrify Chicago, we want to showcase some of the best and worst performing
buildings in the city using publicly available data and manual annotations to add
building photographs and label multi-building owners like universities.
,
a whopping 69% of Chicago's emissions come from buildings, making it
our biggest challenge and our biggest opportunity as a city to tackle
change. At Electrify Chicago, we want to showcase some of the best and worst performing
buildings in the city using publicly available data and manual annotations to add
building photographs and label multi-building owners like universities.
You can start by looking at Chicago's buildings with the highest greenhouse gas intensity - this means that they use the most energy when adjusted per unit of square foot, so big buildings could actually perform much better than very inefficient small buildings on this metric.
New Article
📰 $30 Million In Missed Fines
The City Of Chicago failed to collect $30 million in potential fines from the building benchmarking ordinance, reducing transparency and accountability.
Legislative update! 🎉
As of late January 2024, legislation is being introduced to require new use more efficient forms of water and space heating, via the Clean And Affordable Buildings Ordinance (CABO), which will reduce the number of highly polluting and inefficient buildings that end up on this site.
If you're in Chicago,
write to your alderman to support the CABO!
Chicago Buildings by Greenhouse Gas Intensity
Note: Data only includes large Chicago buildings from 2021, unless explicitly stated otherwise.
Note: This data only includes buildings whose emissions are reported
under the
Chicago Energy Benchmarking Ordinance. According to the City “As of 2016,
this list includes all commercial, institutional, and residential buildings larger than
50,000 square feet.” This dataset is also then filtered to only buildings with
reported emissions > 1,000 metric tons CO2 equivalent.
This data is also from 2021, but when new benchmark data is available, we'll update the site.
| Property Name / address | Primary Property Type |
Greenhouse Gas Intensity (kg CO2 eq./sqft) |
Total Greenhouse Emissions (metric tons CO2 eq.) |
|---|---|---|---|
|
SpringHill Suites - Residence Inn
400 410 N Dearborn St
| Hotel | 9.2 kg/sqft
Highest 19%
| 3,245 tons
Highest 12%
|
|
Grand on Grand Condominium Association
200 W GRAND AVE
| Multifamily Housing | 9.2 kg/sqft
Highest 19%
| 1,361 tons
Highest 34%
|
|
Algonquin #3
1616 E 50TH PL
| Multifamily Housing | 9.1 kg/sqft
Highest 19%
| 539 tons
Lowest 30%
|
|
Smashotels Chicago LLC
228 E ONTARIO ST
| Hotel | 9.1 kg/sqft
Highest 19%
| 1,055 tons
Highest 43%
|
|
St. Leo Residence
7750 S Emerald Ave
| Multifamily Housing | 9.1 kg/sqft
Highest 19%
| 598 tons
Lowest 35%
|
|
Laird Bell Law Quadrangle
1111 E 60th St
| College/University | 9.1 kg/sqft
Highest 19%
| 1,957 tons
Highest 23%
|
|
Gerald Delgado Kanoon Elementary Magnet School
(CPS)
2233 S Kedzie Ave
| K-12 School | 9.1 kg/sqft
Highest 19%
| 619 tons
Lowest 36%
|
|
George Washington High School
(CPS)
3535 E 114th St
| K-12 School | 9.1 kg/sqft
Highest 19%
| 1,945 tons
Highest 24%
|
|
Norwood Park Elementary School
(CPS)
5900 N Nina Ave
| K-12 School | 9.1 kg/sqft
Highest 19%
| 511 tons
Lowest 28%
|
|
Ray Meyer Fitness and Recreation Center
(DePaul)
2235 N Sheffield Ave
| College/University | 9.1 kg/sqft
Highest 19%
| 1,074 tons
Highest 42%
|
|
Park View Towers Condominium Association
2740 N PINE GROVE AVE
| Multifamily Housing | 9.1 kg/sqft
Highest 19%
| 785 tons
Lowest 46%
|
|
112th Street Building
11203 S ELLIS ST
| Office | 9.1 kg/sqft
Highest 19%
| 558 tons
Lowest 32%
|
|
Parkshore Estates Nursing & Rehabilitation Center
6125 S KENWOOD AVE
| Senior Living Community | 9.1 kg/sqft
Highest 19%
| 1,170 tons
Highest 39%
|
|
H/B Winchester, LLC
4500 N WINCHESTER AVE
| Multifamily Housing | 9.1 kg/sqft
Highest 19%
| 740 tons
Lowest 43%
|
|
The Promenade Condominium Association
1201 W ADAMS ST
| Multifamily Housing | 9.1 kg/sqft
Highest 19%
| 767 tons
Lowest 45%
|
Data Source:
Chicago Energy Benchmarking Data